ABSTRACT
Throughout the oil and gas industry corrosion and erosion damage monitoring plays a central role in managing asset integrity. This paper introduces a novel technology for continuous monitoring of wall-loss rates in pipelines.
Corrosion-Erosion Management
- Damage detection
- Estimation of minimum wall thickness
- Monitoring corrosion rates
Cost of inspection/monitoring driven by- Access conditions
- Size of asset
- Frequency of inspection
Permanently Installed UT Sensors
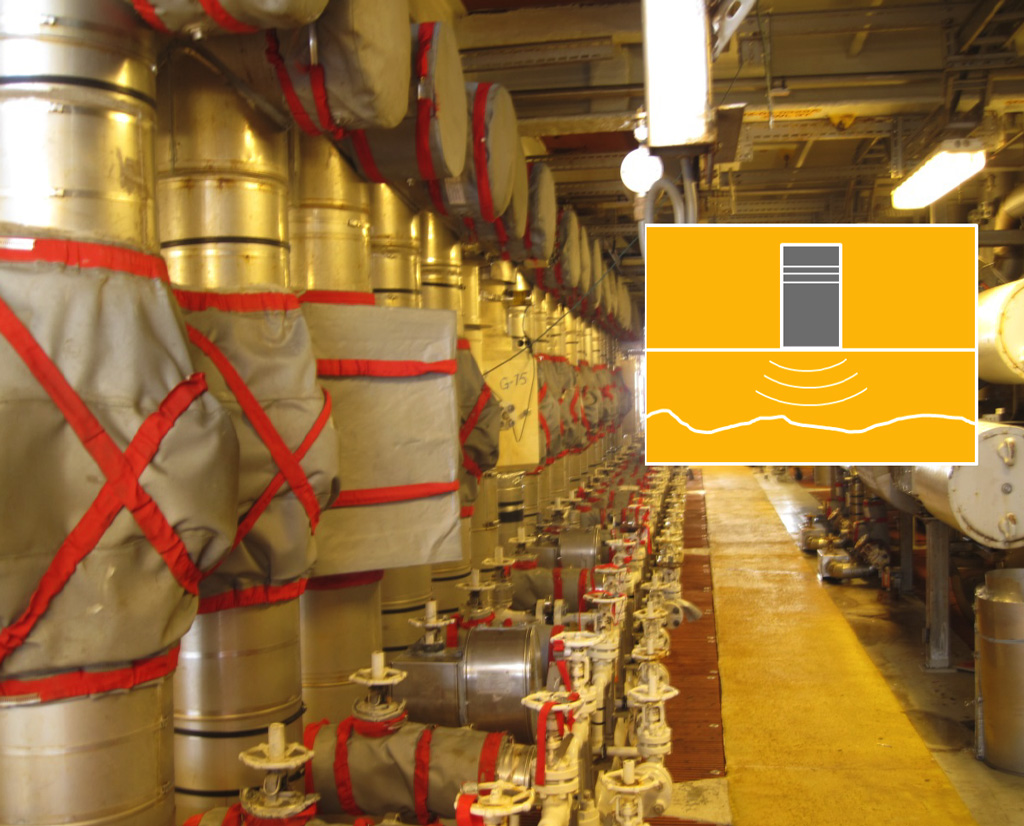
Various UT monitoring systems are already commercially available. They limit the cost of access to the initial installation of the sensors and with remote (wired or wireless) connectivity enable real-time continuous monitoring. They can achieve high accuracy provided that the internal surface of the pipe is smooth and uniform. Area coverage tends to be limited to the footprint of the sensors.
Guided Wave Monitoring
Uses transduction based on non-contact EMAT technology to map wall thickness over the entire pipe section comprised between two EMAT arrays. Typical array separation distance is between 2 to 4 pipe diameters. Operates over a wide temperature range from -40 to 180ºC (-40 to 365°F) and yields maximum depth estimations with accuracy within 1% of wall thickness.
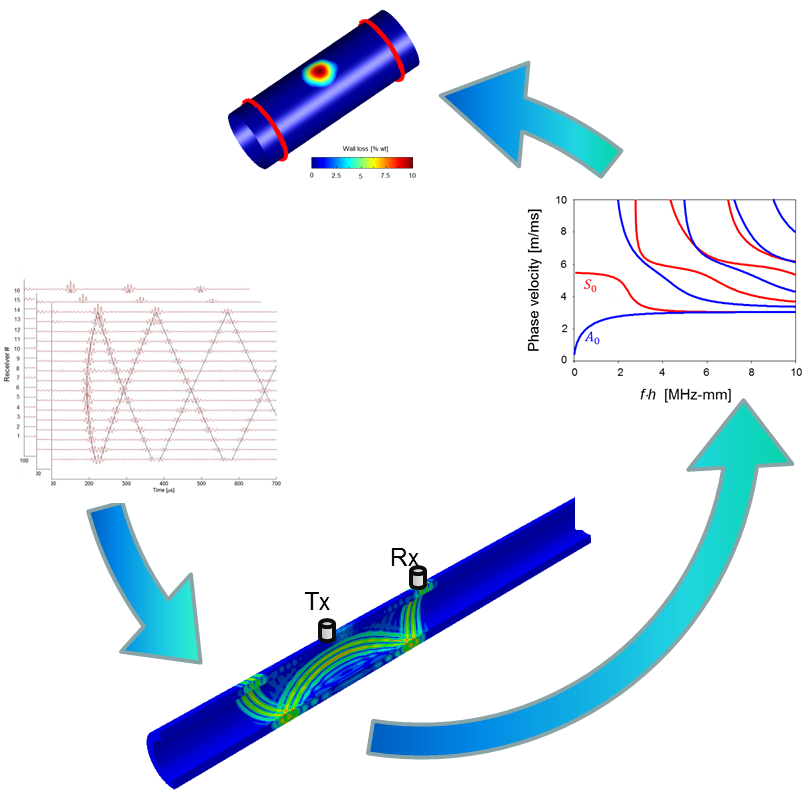
Principle of Operation

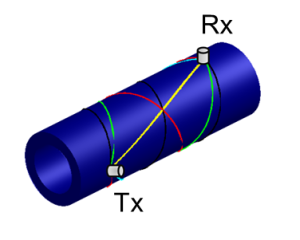
The pipe wall functions as an ultrasonic waveguide. Each EMAT acts as point source producing a cylindrical wavefront similar to the ripples radiating from the point of impact of a pebble on the surface of water. As the wavefront expands it also wraps around the pipe multiple times leading to a complex propagation phenomenon that can be described by rays with helical trajectories.
Helical Modes
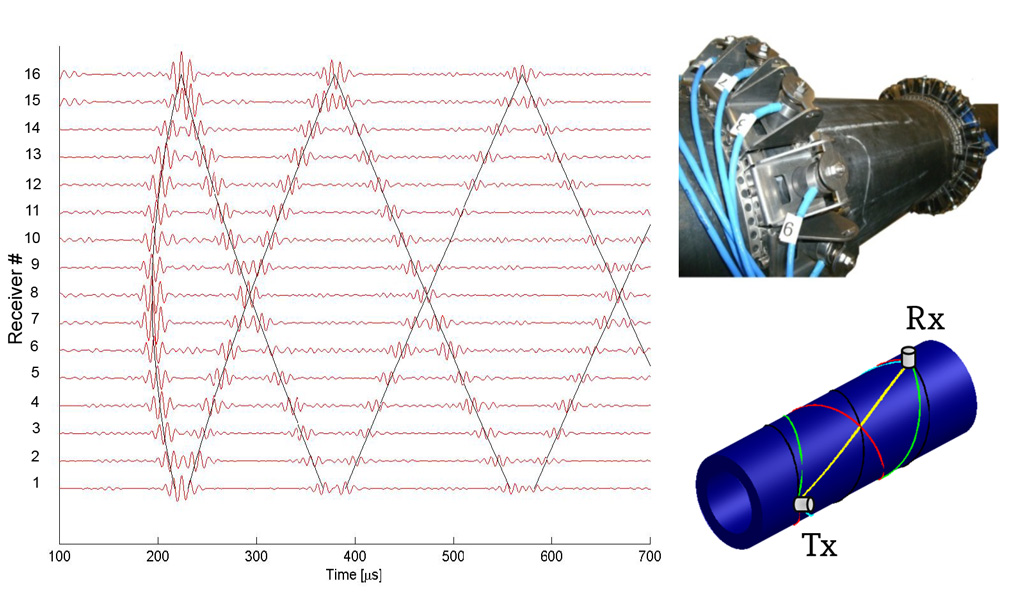
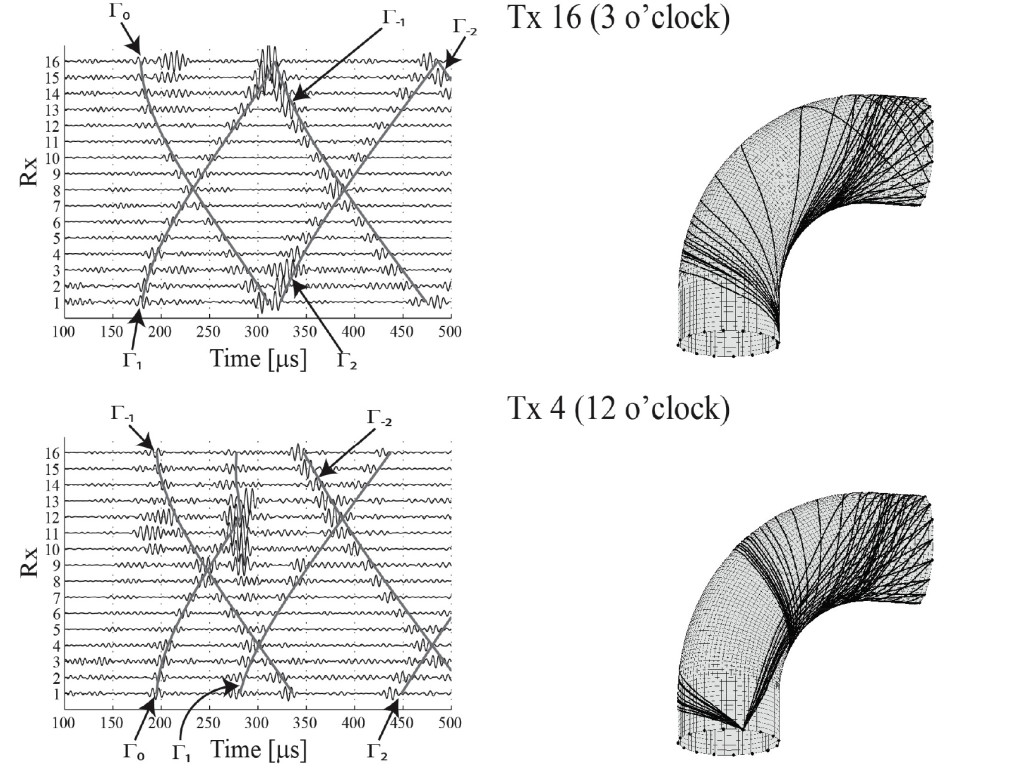
For each source of the Tx array, waveforms are received with all the transducers of the Rx array. Each waveform contains multiple pulses each corresponding to a particular helical path. The different helical paths provide the ray coverage needed to reconstruct the thickness map with sufficient resolution and accuracy. On a pipe elbow the rays follow more complex trajectories corresponding the the geodesics of a torus.
Sensitivity to Wall Loss
Different guided modes can propagate along the wall of a pipe. The fundamental flexural mode,
A0, is highly sensitive to wall thickness losses. This key property is apparent from the approximate Bernoulli-Euler theory of bending waves.
In general wave speed is an increasing function of the ratio between a stiffness parameter,
k, and the mass,
m 
Flexural stiffness is proportional to the cube of wall thickness,
h,
while the mass/unit area is linearly proportional to
h 
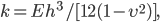
As a result, a small wall loss results in a much larger reduction in flexural stiffness than mass/unit area, thus causing a reduction in wave speed. According to the Bernoulli-Euler theory the wave speed depends on the frequency-thickness product
f  h,
h, and the elastic properties of the material expressed by the Young’s modulus,
E, and Poisson’s ratio

,

Physically, this means that
A0 slows down as it enters a corroded area and then it accelerates as it leaves the defect.
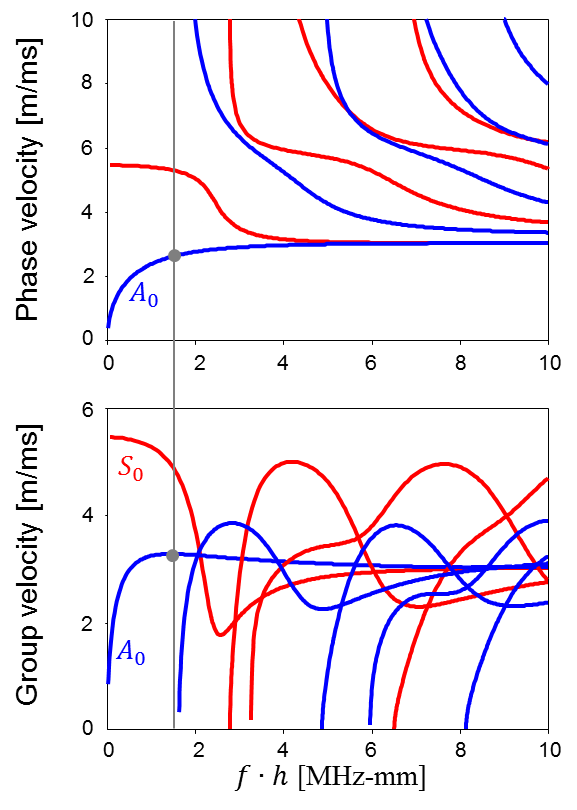
The approximate theory is valid for low

values. Higher frequency requires solution to elastodynamic equations. Among the many different modes that can propagate we select the flexural mode
A0 for its high sensitivity to wall thickness loss. We operate at

MHz-mm corresponding to a maximum point in the
A0 group velocity.
Wall Thickness Reconstruction
The wall thickness map is reconstructed by starting from the measured guided wave signals. Tomographic principles are then applied to map the speed of
A0 across the propagation domain. The reconstructed speed of
A0 is then convert into wall thickness using the
A0 dispersion curve. The speed of
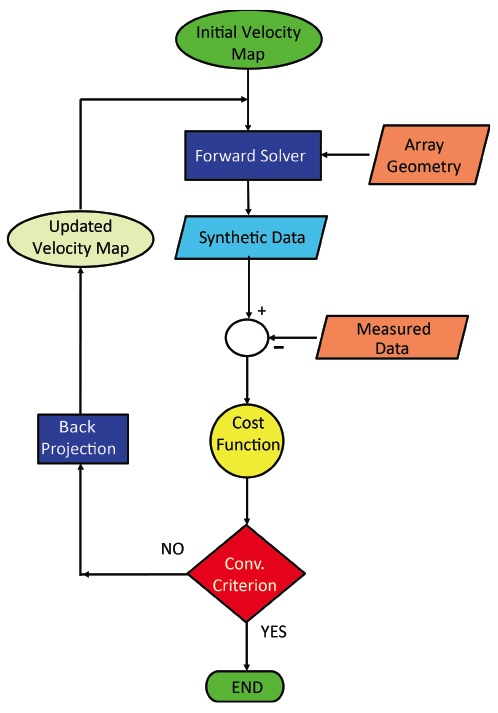
A0 is mapped through model based inversion. A forward model is used to simulate wave propagation for a known velocity map. The velocity map is then adjusted until the prediction from the forward model matches the measurements. Speed and accuracy of the forward model are critical.
Efficient Forward Modelling
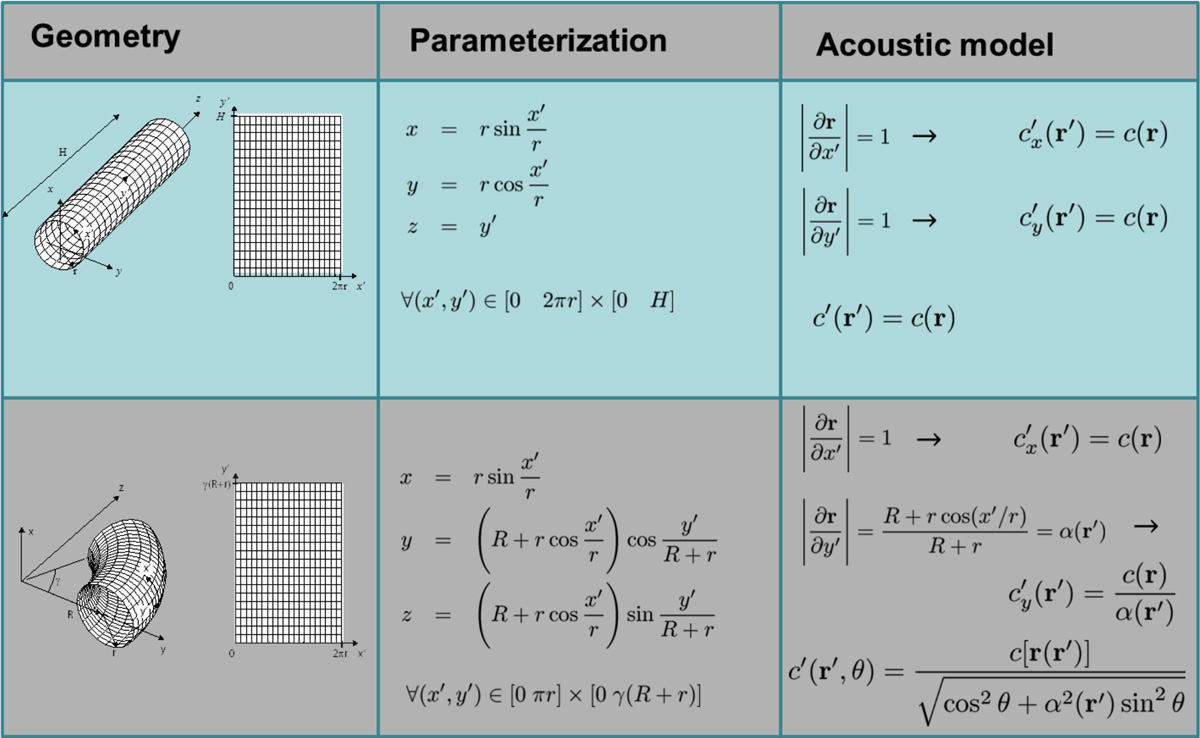
3-D elastic wave propagation can be approximated using a 2-D acoustic model. For curved pipes the acoustic domain is inhomogeneous and artificially anisotropic. FE simulation of one full dataset requires 16 days of computation on a workstation (1 TB RAM, 48 threads, 4 GPUs), the 2-D model takes under one second on a laptop.
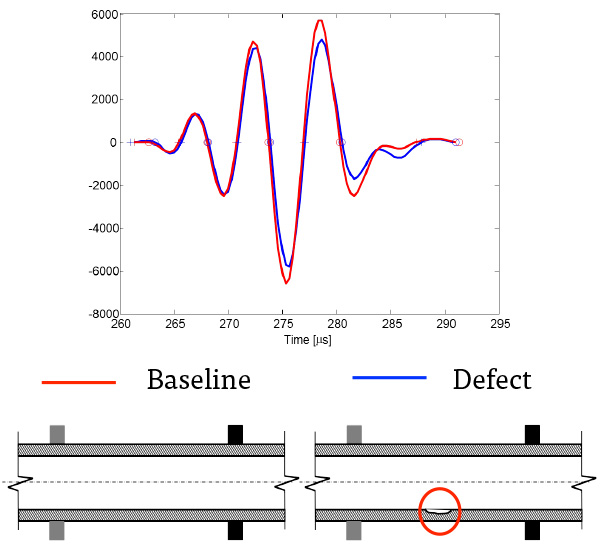
Data for Inversion: The Differential Measurements
The accuracy of model based inversion can be affected by parametric uncertainties about the geometrical characteristics of the undamaged pipe. Due to manufacturing tolerances thickness variations in the order of 10% wt are common in most pipes. Even greater variations are seen in bends. Experiments conducted on a 8” diameter, schedule 40 bend (1.5D bend radius) showed max peak-to-trough variation of 1.72 mm on a 8.25 mm nominal thickness, i.e. 21% of mean wt.
To address these uncertainties we use a differential approach that is aimed at detecting the changes between two states of the pipe rather than its absolute state. Therefore, time-independent uncertainties are suppressed and do not affect the forward model. High accuracy can be achieved beyond manufacturing tolerances. Importantly, there is no need to model welds and other structural features.
Typical Result on Straight Pipe
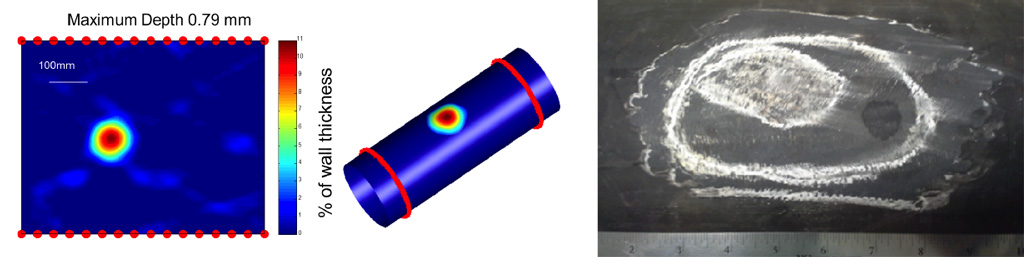
Pipe diameter: 8”
Wall thickness: 7.37±0.05 mm
Defect max. depth: 0.78±0.05 mm
No. Transmitters: 16
No. Receivers: 16
Temp range: 20-175oC
Guided wave mode: A
0Repeatability and Temperature Stability
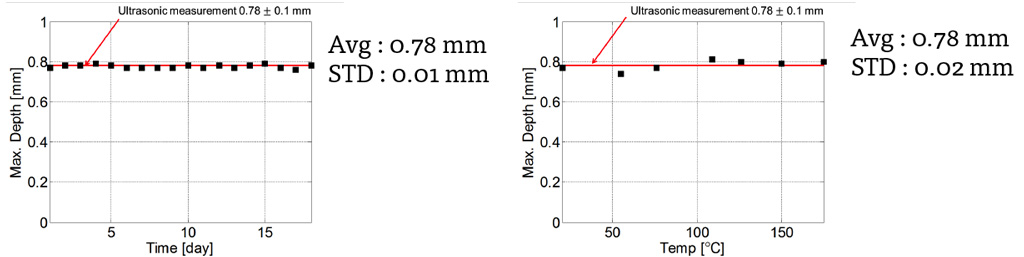
The bond layer of permanently attached piezoelectric transducers is known to be a main cause of thermal instability. For this reason we have developed noncontact EMATs that make the transduction highly stable. In addition, we use the spatial diversity of array measurements to compensate for phase velocity changes in the pipe wall caused by temperature variations.
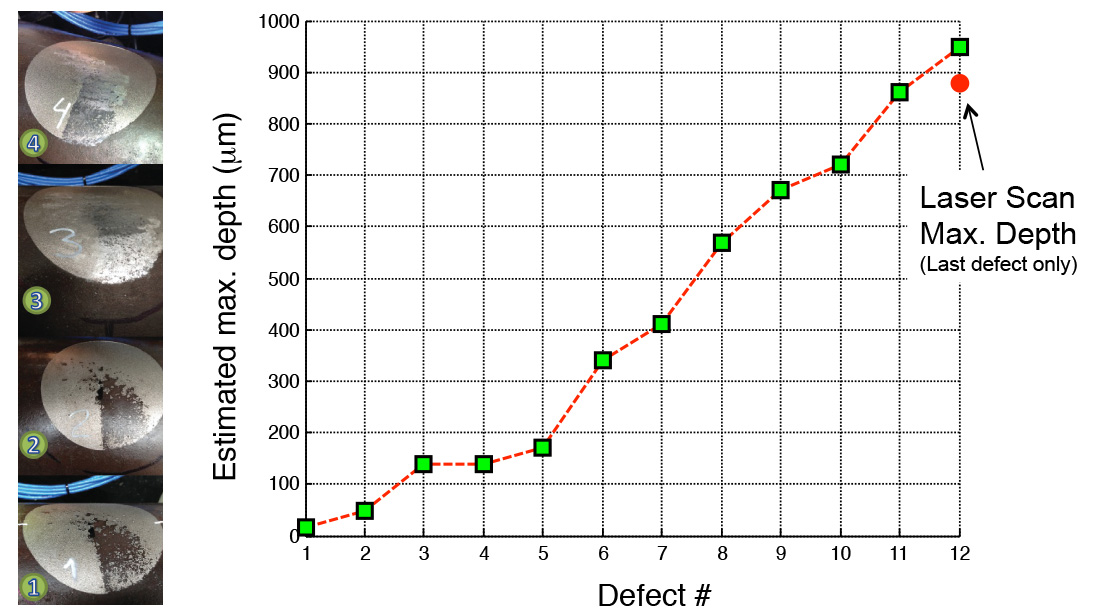
Monitoring Defect Growth
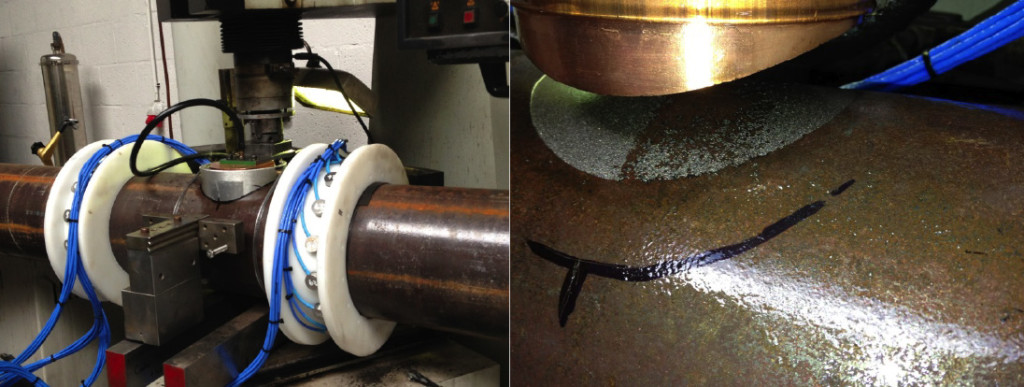
A significant challenge in the experimental validation of pipe monitoring techniques is the availability of techniques to introduce defects with highly controlled geometrical characteristics. Here, an attempt was made to use EDM to produce artificial defects on a 8” schedule 40 pipe at 12 different depths. Guided wave tomography was able to size maximum defect depth over the entire range of simulated depths characterizing defects as shallow as 20 micron.
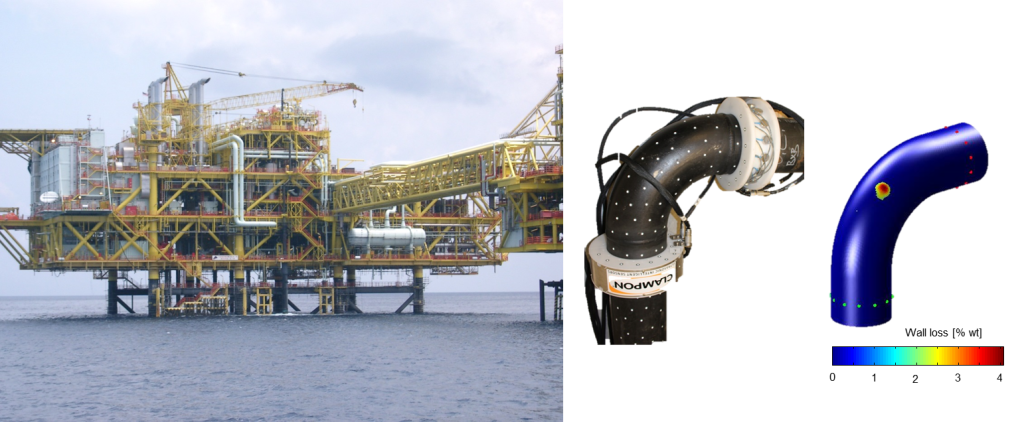
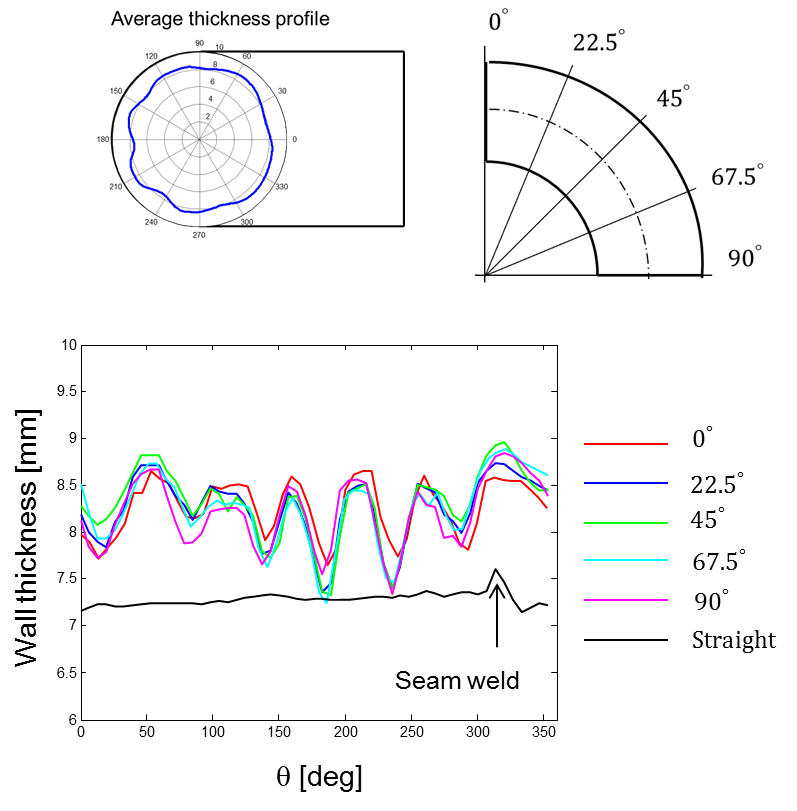
Typical Result on Bent Pipes
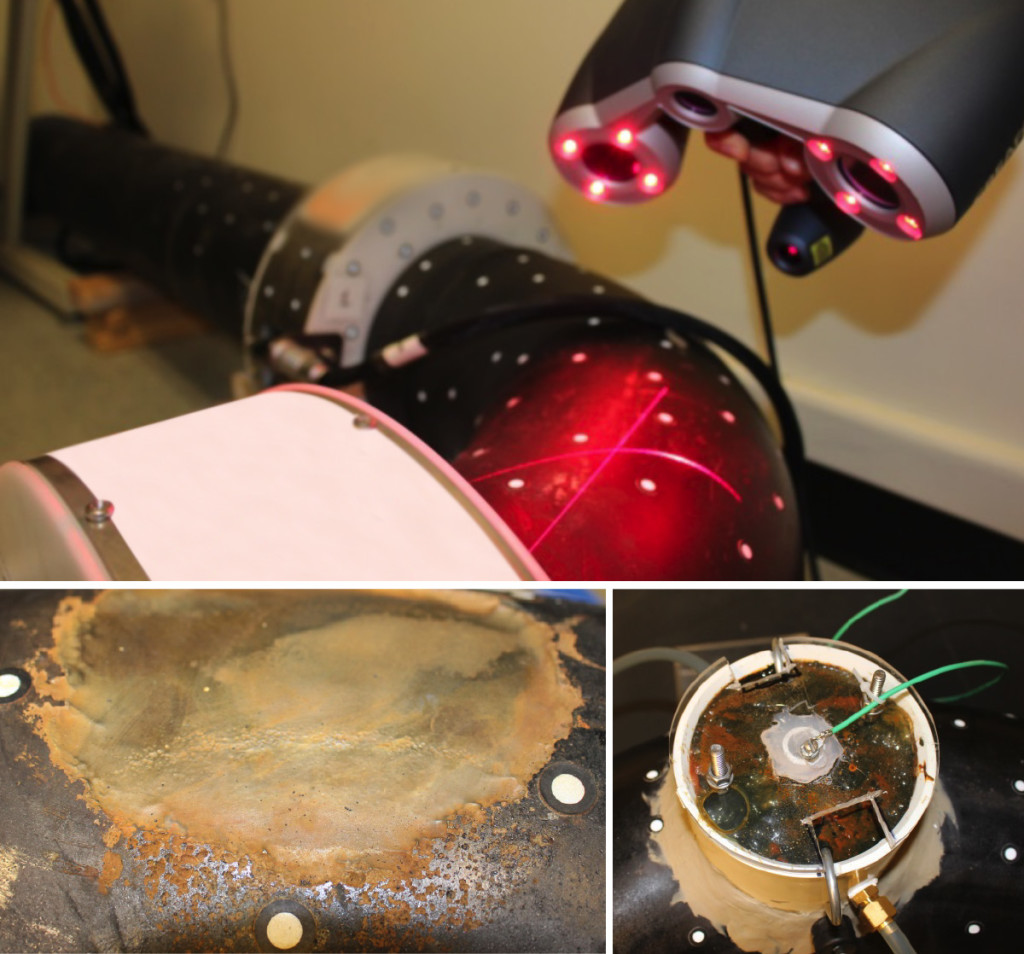
Realistic corrosion defects are introduced using an accelerated corrosion method based on impressed currents. Defects are introduced at different locations around the elbow both from the inside and outside of the pipe. When defects are on the outside, 3-D laser scans are used to benchmark the results from guided wave tomography. For defects on the inside, UT probes are permanently attached on the outer surface of the pipe.
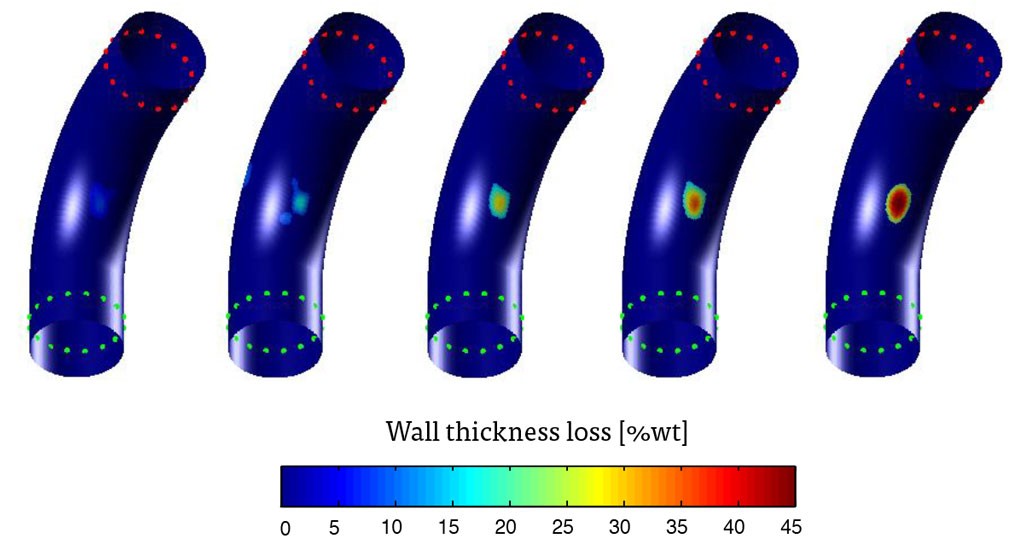
The tomographic maps clearly show the presence of damage on the intrados of the pipe and correctly capture its progression. The defects simulate localized corrosion and are highly irregular as it can be observed from the laser scans below
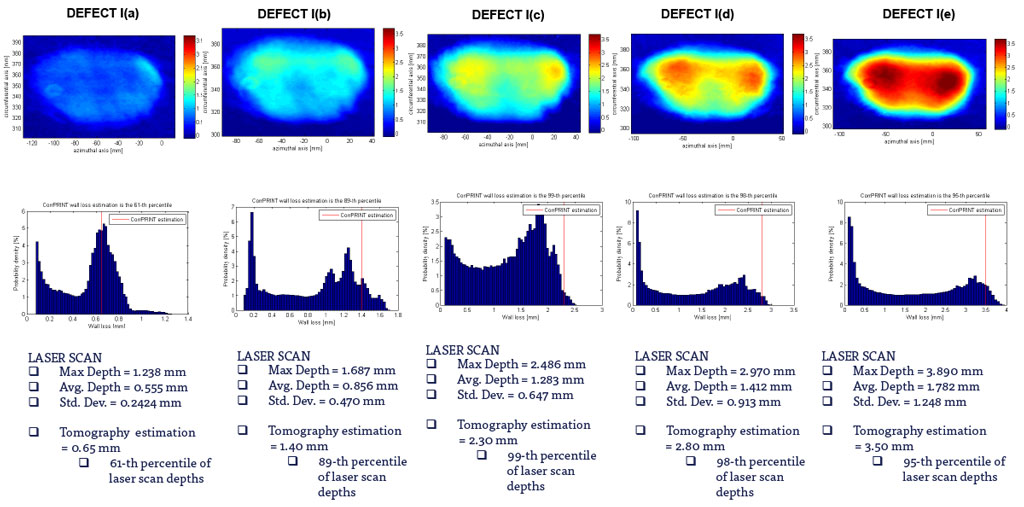
Performance as a Function of Defect Position
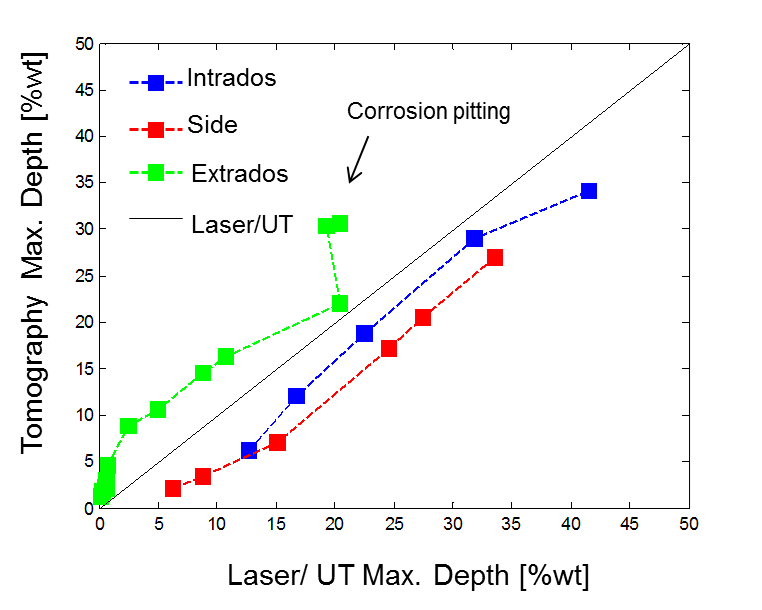
Tomography can correctly predict the defect growth trend. The underestimation on the intrados and side is due to the lower resolution of guided wave tomography compared to the optical laser scan. Due to the highly irregular nature of the defects, there are small areas (few mm in size) of larger depth which cannot be resolved by guided wave tomography. On the extrados, where the defects is introduced from the inside of the pipe, UT underestimates depth because only two points are monitored as explained next.
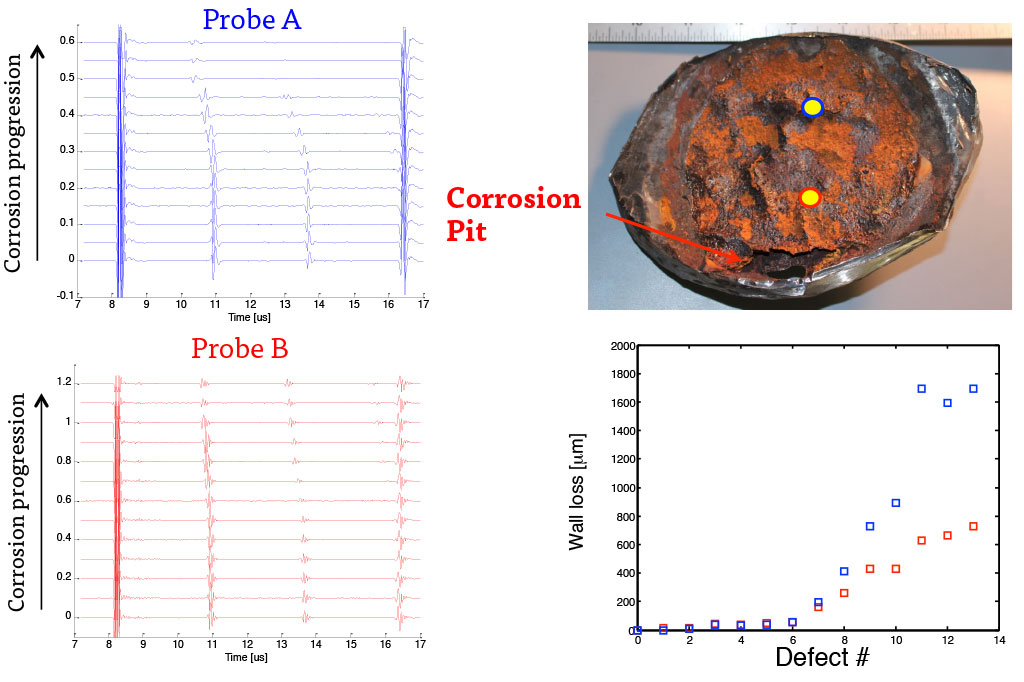
The Advantage of Guided Wave Tomography over Single Point Measurements
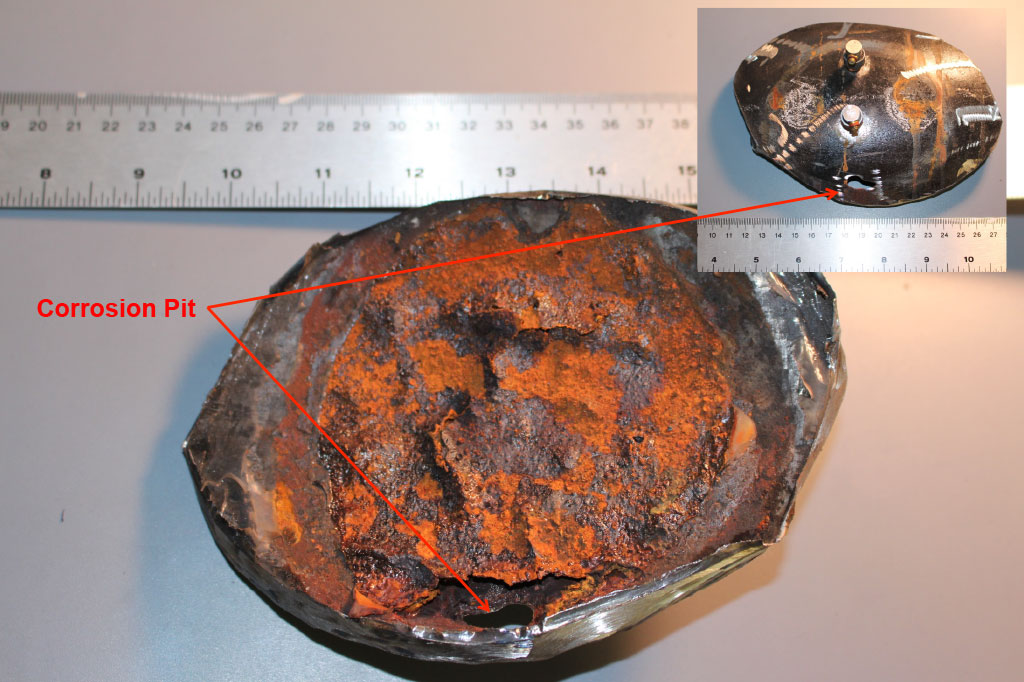
In the presence of aggressive corrosion the interior surface of the pipe can be highly irregular. For the defect on the extrados, a 100 mm diameter corrosion area is monitored with two permanently attached UT probes. The probes grossly underestimate depth due to their limited area coverage. In addition, their sensitivity is affected by the profile of the corroded surface which tends to deflect the ultrasonic beam away from the probe thus causing significant signal loss.
Conclusions
- Computerized guided wave tomography (CGWT) offers a medium-range solution for continuous monitoring of corrosion and erosion damage in pipelines
- In straight pipe sections accuracy in maximum depth estimation is typically better than 1% wt
- Accuracy is not affected by pipe manufacture tolerances (10% wt or more)
- The technology is robust against unwanted signal changes caused by benign factors such as temperature variations
- Possible to monitor damage in both straight and curved pipe sections as well as welds
To learn more about the technology read our journal publications
- P.B. Nagy, F. Simonetti, G. Instanes. Corrosion and erosion monitoring in plates and pipes using constant group velocity Lamb wave inspection, Ultrasonics, 54, 1832-1841, 2014.
- C.L. Willey, F. Simonetti, P.B. Nagy, G. Instanes. Guided wave tomography of pipes with high-order helical modes, NDT & E International, 65, 8-21, 2014.
- A.J. Brath, F. Simonetti, P.B. Nagy, G. Instanes. Acoustic formulation of elastic guided wave propagation and scattering in curved tubular structures, IEEE Trans. Ultrason. Ferroelect. Freq. Cont, 61, 815-829, 2014.